Web I Laboratories, Inc.

Project Management Service Company

WebI ACTY'S ORARIO 12.0 Release Notes
* Click here for the Japanese version of Release Notes.
Introduction
Let us briefly explain about important changes of Kouteizu 12.0.
* This document is subject to change without notice.
“Kouteizu”, ”PREGARE”, ”Planow”, ”Oshika Orario” and ”BarChart Factory” are registered trademarks of Web I laboratories, Inc.
Windows, Excel, and .NET Framework are trademarks or registered trademarks of Microsoft Corporation in the United States and other countries. In this document, the following may be omitted. Please note.
Windows®: Windows Microsoft Excel®: Excel
.NET Framework®: .NET Framework Kouteizu®: Kouteizu
BarChart Factory®: BarChart Factory PREGARE®: PREGARE
Planow®: Planow Oshika Orario®: Oshika Orario
TSV Import/Export®: TSV Import/Export
1. System requirements
System requirements are as follows.
2. Important Changes
2.1. Improved Time Now function
-
Improvements for Time Now function are as follows.
2.1.1. Support hour/minute display when setting Time Now to “Current Date/Time”
-
Time Now shows date/time when it was set to “Current Date/Time” (that is the date/time of computer system rounded with minimum unit of the calendar which was set on Option setting).
-
By changing the Time Now setting from midnight of computer system date to date/time, the gap with current time will be narrowed. Also, when you execute Time Analysis, you can get more precise results closer to real date/time.
-
You need to update date/time manually, except when starting Kouteizu or updating data with external tool. To update manually, click [Update Current Date/Time] button on [Time Analysis Settings] screen. Otherwise, right click the Time Now Line to show the shortcut menu and select [Update Current Date/Time].
-
Also, Oshika Orario 5 operates in corresponding to hour/minute when Time Now is set to “Current Date/Time”.
[Time Analysis Settings] screen
Shortcut menu for Time Now Line
![[Time Analysis Settings] screen](https://static.wixstatic.com/media/1ae9b3_16ae482317064cf6b851f709d472cc99~mv2.jpg/v1/fill/w_600,h_127,al_c,q_80,usm_0.66_1.00_0.01,enc_avif,quality_auto/1ae9b3_16ae482317064cf6b851f709d472cc99~mv2.jpg)
2.1.2 Added Time Now display
-
Time Now is shown on the leftmost part of calendar area.
-
Even when the Time Now Line is not displayed on Bar chart area, you can know the Time Now at a glance.
-
It is displayed in “Current Date Month - Day - Year (Day of the week) Hour : Minute” format, in a row and wrapped at the right end.
-
The color of character is differentiated as for “Current Date/Time” is black and for “Specific Date/Time” is blue, so you can know which one is set at a glance.
2.1.3 Improved Time Now Line display
-
Time Now Line is displayed in blue when Time Now is set to “Specific Date/Time”.
-
By differentiating color as “Current Date/Time” is black and “Specific Date/Time” is blue, you can know which one is set at a glance.
-
It is differentiated in color and drawn in the same way at printing, also.
(Example of displays for Time Now and Time Now Line)
If date/time of computer system is 17:25 on June 3, 2020 and minimum unit for the calendar is 60 minutes.
(1) When Time Now is set to “Current Date/Time”

(2) When Time Now is set to “Specific Date/Time: 12:00 on June 8, 2020”

2.1.4 Added locking function for Time Now Line
-
You can lock moving date/time of Time Now Line executed on Bar chart area.
-
It solves the problem that the Time Now Line is selected with left click by user’s unintended operations, and Time Now is changed from “Current Date/Time” to “Specific Date/Time”
-
Setting is available by checking [Lock Date/Time Movement on Bar Chart Area] checkbox on [Time Analysis Settings] screen. Otherwise, select and check “Lock Date/Time Movement on Screen” from the shortcut menu displayed by right clicking the Time Now Line. In contrast, uncheck that part to cancel.
-
This setting is saved on each Kouteizu file. It is unchecked at initial setting.
[Time Analysis Settings] screen
Shortcut menu for Time Now Line
![[Time Analysis Settings] screen2](https://static.wixstatic.com/media/1ae9b3_9f8b4274908c4e2ab301c6816852e1d5~mv2.jpg/v1/fill/w_600,h_227,al_c,q_80,usm_0.66_1.00_0.01,enc_avif,quality_auto/1ae9b3_9f8b4274908c4e2ab301c6816852e1d5~mv2.jpg)
2.1.5 Improved switching operation for Time Now between “Current Date/Time” and “Specific Date/Time”
-
Switching operation between “Current Date/Time” and “Specific Date/Time” was changed.
(1) When changing from “Current Date/Time” to “Specific Date/Time”
Select the radio button of [Specific Date/Time] for Time Now on [Time Analysis Settings] screen and specify date and time.
Otherwise, left click the Time Now Line and move it to the specific date and time, then left click again.
(2) When changing from “Specific Date/Time” to “Current Date/Time”
Select the radio button of [Current Date/Time] for Time Now on [Time Analysis Settings] screen. Otherwise, right click the Time Now Line to show the shortcut menu and select [Switch to Current Date/Time].
-
When changing Time Now from “Specific Date/Time” to “Current Date/Time”, more intuitive switching became possible than ever.
[Time Analysis Settings] screen
Shortcut menu for Time Now Line

2.2. Added Histogram Group display function that shows total loads for multiple resources
-
For each Histogram Group that is registered as resource, required resources are totaled from its belonging resources and displayed with Histograms.
-
You can grasp load status for each setting group, and load management for the group become easier.
-
”Histogram Group” setting for each resource can be set on Resource Master. Input “Histogram Group Name” for each resource. Resources those inputted the same “Histogram Group Name” is considered as resources those belong to the same “Histogram Group”.
-
On the Bar Property screen, when a resource is selected for Resource required, the item “Histogram Group Name” will be displayed. Besides, this item is only for display.
-
”Histogram Group” on Histogram area will be displayed as shown below.
(1)Display order is below the individual resources that are displayed as before. Display order within “Histogram Group” will be the ascending order of Unicode for Histogram Group Name.
(2)Resource name for “Histogram Group” is shown with blue characters.
(3)It shows Resource required by totaling automatically from individual resources included in the “Histogram Group”. Besides, as it cannot be set Resource Availability, the Histogram for “Histogram Group” are always shown in red.
”Resource Master” screen

”Bar Property” screen Resource required

Histogram area

2.3. Improved function when specifying Timespan of Each Page print
-
At print setting [Selected Span] of [Timespan of Each Page] on [Print – Period and Page Span] screen, if you set “X Months” or “X Years”, the last date of timespan for the page will calculated by calendar day.
-
It solves the problem that extra days had been printed because of the [Timespan of Each Page] was calculated by expected maximum number of days. (Example of expected maximum number of days: specified timespan of 1 month = 31 days, 2 months = 62 days, 3 months = 92 days, 1 year = 366 days)
[Print – Period and Page Span] screen
![[Print – Period and Page Span] screen](https://static.wixstatic.com/media/1ae9b3_8842078b4a194f35b6079da20c35a206~mv2.jpg/v1/fill/w_600,h_560,al_c,q_80,usm_0.66_1.00_0.01,enc_avif,quality_auto/9.jpg)
Example) Output Period = From April 1, 2020 to December 31, 2020
Timespan of Each Page = 3 Months

2.4. Added copy Bar chart to clipboard function
-
You can copy Bar chart to clipboard and paste it directly to Office applications, etc.
-
You had to save it once as an EMF file to paste it as an image on Office applications before, but those operation became unnecessary.
-
The procedure is, select the page you want to copy from full page display on the right side of print preview screen, then click [Copy Current Page] button.
-
By operating copy and paste while the preview screen kept open, you can execute continuous copy without closing preview screen.
[Preview] screen of print
![[Preview] screen of print](https://static.wixstatic.com/media/1ae9b3_112e53a6a8b6485aaeab8d3851b51a81~mv2.jpg/v1/fill/w_600,h_349,al_c,q_80,usm_0.66_1.00_0.01,enc_avif,quality_auto/1ae9b3_112e53a6a8b6485aaeab8d3851b51a81~mv2.jpg)
2.5. Added Line Number display function
2.5.1. Restrict registration of Resource required amount for Group Bar
-
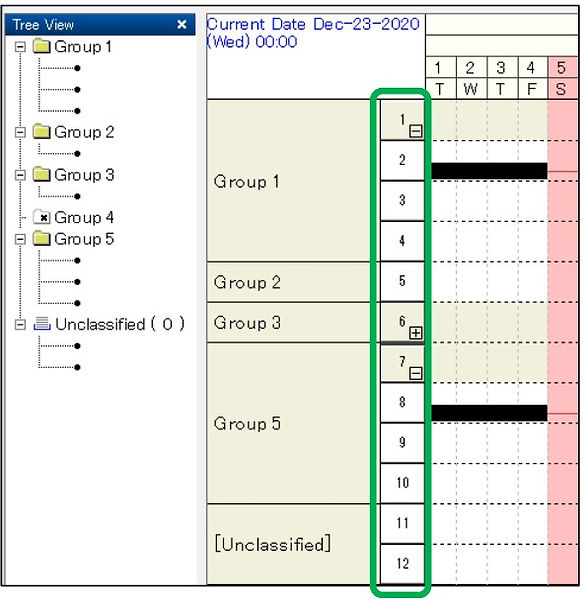
“Line Number” can be displayed at Line Choose cell (the part that “Page Break Mark” can be displayed).
-
By using “Line Number”, you can easily indicate where the specific line is located verbally and carry out the meeting smoothly.
-
Select [Page Break Mark / Line Number] from first hierarchy of View menu, then select “Line Number” shown at the second hierarchy. You can select either one between this or existing “Page Break Mark”, and the setting is made for each file.
-
”Line Number” shows the serial numbers from top for the rows and group bars displayed on the Group Name Area at the moment.
-
Displayed on Task view and Category view 1 to 4.
-
Line Numbers displayed by this function are not drawn at printing. If you want to draw Line Numbers at printing, please select existing option of “Draw Line Number”.
Tree View and Group Name Area
2.6. Added Preceding and Succeeding Bar search function for Milestones
-
You can jump to “Preceding Bars” or “Succeeding Bars” from Milestones.
-
Same as for the Task Bars, you can easily select the Preceding and Succeeding Bars for Milestones.
-
Right click the Milestones to show shortcut menu and select “Preceding Bars” or “Succeeding Bars” shown on the first hierarchy, then by selecting the process name shown on the second hierarchy, you can select the Bar and jump to there.
Shortcut menu for Milestones

2.7. Improved display of Resource Name in By Resource View
-
Multiple Constraints can be selected collectively.
-
Without holding down Ctrl key and click Constraints one-by-one, you can easily select multiple Constraints.
-
By dragging mouse while holding down Alt key, all the Constraints included within the dragged area even partially, will be selected. Furthermore, by dragging the mouse while holding down Alt and Ctrl keys, multiple Constraints will be selected additionally.
-
When dragged without pressing Alt key, Bars included within the dragged area will be selected as same as before.
-
Bars and Constraints cannot be selected simultaneously.
-
Also, when you right click to display a shortcut menu after selecting Constraints, the shortcut menu will not be shown if you kept pressing Alt key. Please right click after you released Alt key. This is caused by function of Windows.

2.8. Added Align Right function on Bar chart area
-
Characters on Bar chart area can be displayed as “Align-Right”.
-
“Align Right” were added to character alignments of “Align Left” and “Align Center”, you can arrange characters freely than ever.
-
After selecting Bars, select “Align Right” button located on the Toolbar.
-
Display position for ”Align Right” will have the origin at the rightmost side of the Bar as much as possible. (According to the display of “Align Left” that has origin at the leftmost side.)
Toolbar

2.9. Added highlight display function for Baseline Bar
-
When an Active Bar (Milestone, Group Bar, or Task Bar) is selected, the color of symbols for left, right and center of its corresponding Baseline Bar will be displayed in specified color (default setting is sky blue).
-
Even when there are multiple Active Bars and Baseline Bars in one row, you can know the corresponding Baseline Bar to the Active Bar at a glance.
-
In this case, the shape of symbol for the Baseline Bar will not be changed.

2.10. Added progress display function for Hidden Symbol
-
Active Bars with Hidden Symbols can be filled in black according to the progress.
-
You can create forms without showing the expected end date of the newest plan, and shows only the start date and the progress status at the moment.
-
By checking [applied to Hidden Symbols as well] checkbox in [Bar Drawing Rules] tab on Options of menu, the progress will be filled in black when it registered to the Hidden Symbol.

2.11. Added options when Bars including Hidden Symbols are overlapped
-
When you want to show characters in the middle of an Active Bar, that can be displayed by placing Hidden Symbols at the position and registering characters. In this case, you need to set added option.
-
The added options when the Bar including Hidden Symbols were overlapped are as follows.
2.11.1. Do not change colors when the Bars including Hidden Symbols are overlapped
-
When Hidden Symbols are included, you can set up to disable changing color that shows the overlapping of Active Bars.
-
When the Bars including Hidden Symbols are overlapped, the setting color for the Bar Symbols is retained.
-
This can be set by checking [Do not change overlapping bars to specified color when they include Hidden Symbols] checkbox in [Overlapping Bars] in Advanced Option on Kouteizu Configuration.
-
The color of Bars overlapped with the Bars those do not include Hidden Symbols, will be changed even this option is checked.

2.11.2. Do not cancel overlapping Bars automatically when the Bar includes Hidden Symbols
-
When Hidden Symbols are included, you can set up to disable automatic cancellation of Register progress to Hidden Symbol Before Bar incluging Hidden Symbols Warn overlapping with color Now The color does not be changed 12 overlapping for Active Bars.
-
When you overlapped and placed the Bars including Hidden Symbols, it retains the setting of placement for the Bars (previously, when the Bars were overlapped, it always add rows and move the objective Bars automatically at restarting Kouteizu or switching views to cancel overlapping Bars).
-
This can be set by checking [Do not rearrange overlapping bars automatically when they include Hidden Symbols] checkbox in [Overlapping Bars] in Advanced Option on Kouteizu Configuration.
-
If you set the kouteizu.settings = false, the function of disable automatic cancellation is prioritized. In this case, the checkbox for [Do not rearrange overlapping bars automatically when they include Hidden Symbols] in Kouteizu Configuration is unable to set and will be unchecked status.
-
Even this option is checked, the overlapping Bars those do not include Hidden Symbols will canceled automatically as same as before, so please cancel overlapping Bars beforehand.

2.12 Added import/export function for print setting information
-
Import/export the print setting information is possible.
-
You can hold several print settings by files or share the settings among users easily.
-
By clicking [Import Print Setting File] button at the first [Print – Destination] screen, you can import saved print setting file. Also, by clicking [Export Print Setting File] button at the last [Print – Options] screen, you can save current print setting to a file.
-
The initial display of Print setting is not changed.
Each screen of Print

3. Important changes for standard tools of Kouteizu
3.1. Added functions for Excel Bar Chart
-
Added functions for Excel Bar Chart are as follows.
3.1.1. Multi-view output function
-
You can specify Task view and Category view 1 to 4 as output target.
-
You can output easily when you create Bar chart on Category View and provide it as Excel file.
-
Outputting view can be changed by [Select View] on the start screen of the tool. The view on Kouteizu at starting this tool will be set by default.
-
The name of selected View will be set for the sheet name of output Excel file.
-
If a view name contains unavailable symbols for sheet name on Excel, those symbols will be replaced by underscore (_) in sheet name.

3.2. Added functions for Excel Bar Chart (S-curve)
-
This tool is attached to Kouteizu M+ option.
-
Added functions for Excel Bar Chart (S-curve) are as follows.
3.2.1. Multi-view output function
-
You can specify Task view and Category view 1 to 4 as output target.
-
You can output easily when you create Bar chart on Category View and provide it as Excel file.
-
Outputting view can be changed by [Select View] on the start screen of the tool. The view on Kouteizu at starting this tool will be set by default.
-
The name of selected View will be set for the sheet name of output Excel file.
-
If a view name contains unavailable symbols for sheet name on Excel, those symbols will be replaced by underscore (_) in sheet name.
3.2.2. Output function for Baseline Bar
-
You can output with Baseline Bars included.
-
When using for conference material, you can compare planned and actual Bars in addition to S-curve.
-
By selecting [3 Tiers - Name, Plan bar, Active bar (Progress: Filled)] from Bar Layout on Setting screen of the tool, the Baseline Bar will be output. Also, when this layout is used, the progress will be displayed on the Active Bar. When [2 Tiers – Name, Active Bar] was selected, they will be shown with the format of only name and Active Bar as same as before.
-
The progress part of the Active Bar is output with filled in black normally, but only when the symbol color for Active bar is set to black on Kouteizu, it will be filled in gray color.
-
The improvement of the fill-in color to be gray is modification from the prerelease version.

3.3. Added Group Creator
-
Details for Group Creator that added newly as add-on tool for Kouteizu are as follows.
3.3.1. Group Creator
-
With Group Creator, you can copy hierarchy information created by Excel and so on to create groups for Kouteizu easily.
-
By using this tool, you can reduce man-hours for group creating works at the first stage of Bar chart creation.
-
This tool can start from Tool menu of Kouteizu. For details of how to use, refer to the Help of this tool.

3.4. Improvements of BarChart Factory
-
Improvements for BarChart Factory are as follows.
3.4.1. Magnification change for screen by using mouse wheel
-
Zoom setting for the screen can be changed with CTRL key and mouse wheel scrolling.
-
You can operate intuitively as the same way as general products such as Office.
-
Zoom in/out are possible by holding down CTRL key and scrolling mouse wheel up and down.

3.4.2. Locking function for objects
-
Objects can be locked.
-
By using this function, you can avoid moving figures by mistake while editing.
-
Objects can be locked by right clicking to display the shortcut menu and selecting Lock. Also, by clicking Lock again, lock will be canceled.

3.4.3. Transparent PNG setting for each image
-
Transparent setting of PNG images can be set for each image. Also, you can set the fill color if it does not set to transparent.
-
You can set transparent only for the specific image or set fill color other than white to make distinguished.
-
Setting can be made on Fill column on Properties for the image.


-
This setting can be used only when the existing transparent setting is enabled for the entire pattern file.
-
Refer to the following table about the relationship with the existing setting.

3.4.4. Improved transparent setting for the entire pattern file
-
When the Option setting is changed, the contents of the change will be applied immediately. Also, the default setting for this option was OFF before, but that will be ON when you installed newly. When you upgrade the version, the setting will be the same as the previous version.
-
When you changed the Option setting to enable the transparent PNG process, you can check the changed result without re-opening the pattern file.
-
Setting can be changed from Option in File menu, as same as before.

3.4.5. Added Text Margin setting
-
Setting Text Margin is possible for objects that can be insert text, such as Text Box or To Do List.
-
It enables the text to be arranged naturally, when you set the display setting of the text other than align center.
-
Text Margin can be set on Properties of the figure.
-
When you created objects newly on BarCart Factory, it will be set to 2 by default.
-
The objects included in the file created by BarChart Factory of Kouteizu 11.0 or earlier version is read as 0 setting, so you can use files created by older version with the same layout as before.

3.4.6. Added Mail Merge Field
-
Two types of item, PRINT_START_DATE and PRINT_UNTIL_DATE are added.
-
You can insert the start date of printing period and the end date of printing period to Mail Merge Field.
-
You can set this from Format on Properties, as same as other items.

4. Other improvements and bug fixes
-
The arrangement of Toolbars (Standard and Option) at initial installation were changed from two rows to one row.
-
Corrected to include progress = 0% as display target when “progress” is selected on Bar Layout setting.
-
Corrected to enable to switch setting of the Page Break Mark even when the Group information cannot be edited.
-
Corrected the bug that the bar having progress and zero duration was not to be the fixing target at Time Analysis.
-
Corrected the bug that the scale indicating the separator of Period was not cleared even the amount of supply is equally set at both back and forth of the separator on Resource Availability View of Histogram.
-
Corrected the bug that the contents of shortcut menu (Show/Hide of Groups, etc.) were not shown properly when right clicking the Group Name area while that Group Name is not wholly 20 displayed in the screen on Tree View.
-
Corrected the bug that the display of the Baseline Bar with Roll-up (Business day) setting had a gap with the duration on Bar Property.
-
Corrected the bug that the Finish Date of the Baseline Bar was incorrect if a Baseline Bar was created to the Group just after pasted by Copy to Group.
-
Corrected the bug that the lower part of the screen was not the display of today when the screen was split and [To today] button was clicked.
-
Corrected the bug that abnormal end occurred by moving mouse to Overall Image after cancelling split screen.
-
Corrected the bug that the setting became incorrect when [Draw calendar unit as detailed as possible] is checked on Print - Options.
-
Corrected the bug that the displayed date was subtracted one day when the Finish Date of the Task Bar was entered with mm/dd format on WBS Editor.
-
Corrected the bug that the preview might not correspond to actual display on Tool Menu Editor.
-
Corrected the bug that an error occurred when the Milestone Name field was set to blank on Excel Bar Chart.
-
Corrected the bug that an error occurred when a printer those do not support A3 printing was selected on Excel Bar Chart (S-curve).
-
Discontinued “Kouteizu: Quick Start Guide”, that was the attached material until Kouteizu 11.
5. About kzd files compatibility between Kouteizu11 and Kouteizu12
-
kzd files created in Kouteizu 11 can be referenced and updated in Kouteizu 12.
-
kzd files created in Kouteizu 12 can be referenced and updated in Kouteizu 11.
-
New functions of Kouteizu 12 is not available in Kouteizu 11.
6. About compatibility with other products
-
You can use with our other products of following versions. PREGARE (13/12), Planow (6.3/6.2), Oshika Orario (5/3), TSV Import/Export (2.4/2.2)
-
Back up your own TEXT_COLOR.csv and IMAGE_COLOR.csv that you have configured just in case.
-
Change the modified date, which is a property item for TEXT_COLOR.csv and IMAGE_COLOR.csv that are saved in the prescribed folder, to a date after the release date of Kouteizu 13 (1/17/2022) or later
7. About limitations
-
The limitations at releasing Kouteizu 12 are as follows.
2.1.2.Added Time Now display
It is not drawn at printing.
2.1.4.Added locking function for Time Now Line
If you use Planow, you need to save and update this setting from “All(kzd)” on Project information.
2.2.Added Histogram Group display function that shows total loads for multiple resources
If you use together with PREGARE or Planow, they are unsupported and cannot be used.
Also, TSV Import/Export is unsupported and cannot be used.
2.5.Added Line Number display function
Up to 4-digit (9999) can be displayed as “Line Number”. 5-digit (10000) or more of “Line Number” cannot be displayed.
Resource View is out of target for display.
If you use Planow, you need to save and update this setting from “All(kzd)” on Project information.
2.8.Added Align Right function on Bar chart area
As for TSV Import/Export, if you import the file exported with “Align Right” status, an error will occur. In this case, by changing the character alignment of TSV file to “Align Left” or “Align Center”, import becomes possible.
Also, if you set “Align Right” and saved on this version, and then opened the file with version 11 or earlier, that will be regarded and displayed as “Align Left”.
2.10.Added progress display function for Hidden Symbol
If you use Planow, you need to save and update this setting from “All(kzd)” on Project information.
2.12.Added import/export function for print setting information
If you set [Zoom To] for Magnification on [Print – Options], the value of [Zoom To] is out of target of this function. If you imported a file that selected [Zoom To] for Magnification, the value of [Zoom To] will be displayed as 100%.
3.1.Added functions for Excel Bar Chart
3.1.1 Multi-view output function
Resource View is out of target for output.
3.2.Added functions for Excel Bar Chart (S-curve)
3.1.1.Multi-view output function
Resource View is out of target for output.
3.4.2.Locking function for objects
This setting is not reflected to BarChart Factory of Kouteizu 11 or earlier. Also, if you overwrite and save with BarChart Factory of Kouteizu 11 or earlier, it will be saved as unlocked status.
3.4.3.Transparent PNG setting for each image
When printing the file that transparent setting to valid, the transparent parts might not be printed normally according to the printer. In that case, please invalid the transparent setting and execute print.
3.4.5.Added Text Margin setting
This setting is not reflected to BarChart Factory of Kouteizu 11 or earlier. Also, if you overwrite and save with BarChart Factory of Kouteizu 11 or earlier, it will be saved as the setting value zero.
8. About maintenance service for Kouteizu 11 or earlier
-
Sales of the previous version will be terminated at the same time as Kouteizu 12 starts on sale.
-
Also, the protect key will continue to be issued for the license those had already been purchased.
-
In addition, we will continue to respond to inquiries from customers who have contracted maintenance services.
***************************************************************************
◆Important notice◆
Previously, reissue of protect key at the customer's convenience, such as changing the PC used in the Kouteizu, had been supported free of charge for all customers. But from April 1, 2020, we limited the scope of the free reissue only to the customers with service contract.
For customers without service contract, we would charge 8,000 yen (excluding tax) for every reissue of a protect key.
For consultation on service contracts, please contact our support team. (TEL: +81-3- 3570-2392)
***************************************************************************
© 2020 Web I Laboratories, Inc.